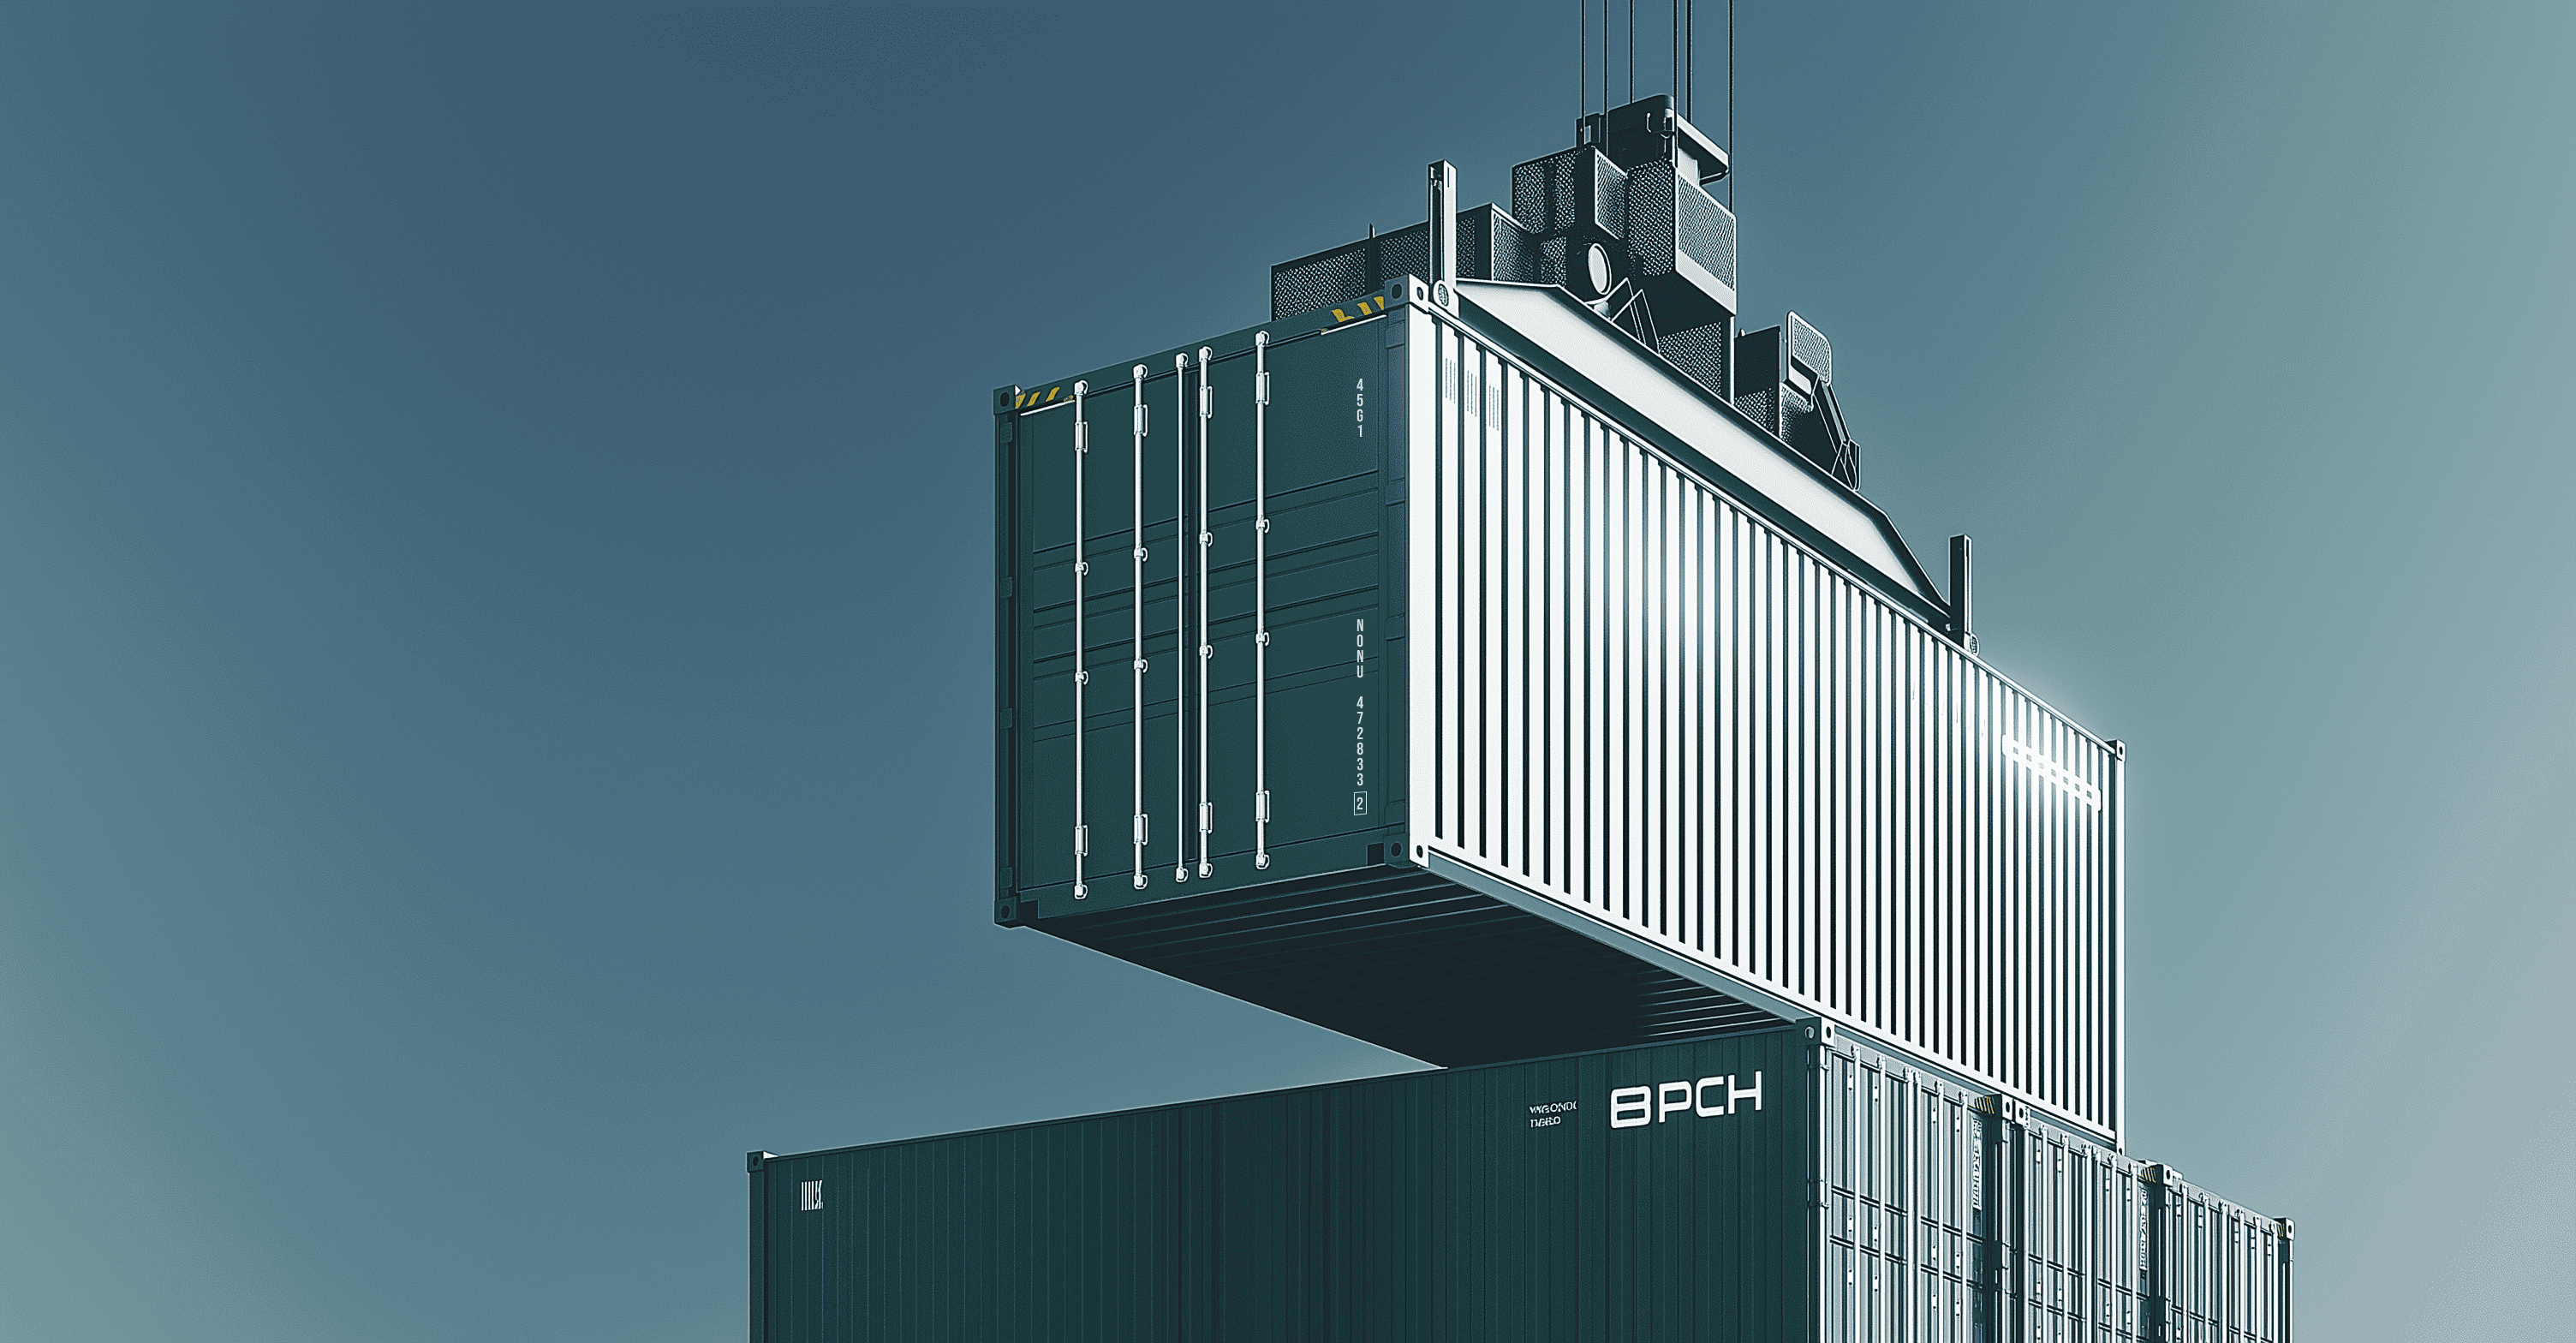
Overview
The end-to-end digital shipping platform that manages all stages of maritime shipping. This case is about digitalization, strategy, continuous discovery and love for the sea.
Industry
Maritime,
Enterprise B2B
PHASES
Discovery, Research, Ideate, Validate, Delivery
Team
20 +
DURATION
2 years
NDA project. My commitment to confidentiality limits the level of detail I can share, including full workflows, files and mockups. Still, this project was a major part of my work for two years and one of the most meaningful. It would be a shame to hide it completely.
So here, I am sharing a narrative version of the story with adjusted brand identity and selected workflow details. I’ll be happy to talk through the backstage during an interview. And now, find your spot on deck. We are setting sail into my first screenplay.
Scene 1 —
Boarding
DESIGNER: I join a project with about twenty different modules. Each one feels like a complete product, but they were not grouped into clear processes. They cover only some parts of the clients’ day-to-day flow. Our task is to create and organize these modules into a product that supports the full basic workflow. What this flow should look like, we do not know yet. We will have to discover it. The team is great and multicultural, so we will figure it out together. We set our course and prepared to dive in.
Then come many demos, calls and interview recordings. It becomes clear very quickly. The deeper I go, the wider the gap becomes. And for a moment, I feel lost. In other domains, by the third month I usually feel confident. Here, I work intensely, but the deeper I go, the more I realize how much I still do not understand. I understand only a small part of the abbreviations our users use. And the «charterparty» we are supposed to reach is not a party at all. For a moment, I think our module might end up at some kind of celebration. But no. It is heading straight into the world of contracts.
(On-screen note: «Charterparty — a contract between a ship owner and someone who rents the vessel to transport cargo.»)
Scene 2 —
The Challenge
A company strategy session. Long-term goals for the next three years appear on a large screen.
CEO: Let’s implement an «Uber-like» approach.
THE TEAM (together): Of course.
(A short pause. People close their laptops. Chairs move. The room slowly empties.)
DESIGNER (speaking quietly, more to herself than to anyone else): But the reality of this industry is much heavier than the idea of «Uber-like». Maritime companies are trying to move toward digitalization and automation. They want to break away from traditional silos and bring separate processes together. And complexity grows fast. There are diverse workflows, unique roles, strict laws, sanctions and unpredictable market conditions. Each part of the business works in its own rhythm.
Before we can even start designing, we need to face the real problem behind our work. Clients rely on separate sources: standalone tools, Excel files, long email threads and verbal agreements. This creates a heavy mental load, slows down negotiations and increases operational risks, which can cost millions.
Alright. The vision makes sense. And we do need a platform that finally connects everything.
DESIGNER (smiling, thinking for a moment):
If this were Uber, I would talk to drivers, draw the routes… But here, the «routes» shift with weather and port schedules, and the «drivers» own ships worth more than whole companies. So… a ship owner contact, anyone?
Scene 3 —
Building common ground
A quiet meeting room. Screens glow with maps, notes and open Figma frames. Voices overlap. Someone sketches processes on a whiteboard.
DESIGNER: In the bigger picture of the project, our module already starts to take shape, but only on paper, not in real life. I join during the discovery phase led by our PO and quickly realise that this phase is not about collecting answers but about understanding how everything actually works. It includes in-depth interviews, process observation and watching how data moves between people and systems. We meet with maritime experts to understand their world. «A ship owner contact, anyone?» finally stops being just a joke. These are people with deep knowledge and very little time, so each conversation becomes a mix of learning, decoding and mapping the system right after the call, before we forget any detail.
CLIENT: We are going on subs tomorrow.
PO: Sorry, just to confirm… you said «on subs»?
(Time passes. The interviews continue. The glossary grows.)
DESIGNER: And now I am building the first prototypes. We validate them with first click testing and moderated usability sessions, and each iteration brings a new detail we do not expect, so we keep refining and adjusting. In parallel, development starts. I work on establishing design patterns, layouts and rules and actively contribute to the common design system. Development follows a two week Scrum cycle using the product trio approach.
CUT TO: a design call in progress. Fifteen designers on one Teams screen. Miro boards open with sticky notes moving in real time. A lot of talking.
DESIGNER (turns off camera, hits mute and explains quietly to the reader): At the same time, we work on persona alignment across the company. The design team is still new, as the platform was originally built by engineers and domain experts, not usability people. There are no ready personas at this point, so this becomes a big part of our work. Everyone brings knowledge from their own module, and we look for patterns together, often in workshops with affinity diagrams. The moment our Miro board stretched to three meters wide, we understood one thing: it’s officially time to draw a proper process map.
Here is the process
we use across modules

Discovery phase
learn first
We dive into early discovery to understand how the domain actually works, together with experts and stakeholders.
Structuring and persona alignment
align early
User input
validate often

Scene 4 —
Shifting course
CEO: We are changing direction. New priorities.
DESIGNER: It is storming — not outside, but inside the project. Strategic priorities shift, the company restructures and our direction needs to change. Our PO stays on the original module to explore the new course and gather the updated requirements. The rest of the team moves to other modules. I move to the one that actually works with storm forecasts, which feels strangely symbolic.
(A pause. The scene lingers on the new map — uncertain, unfinished, open.)
TITLE CARD: 18 months later
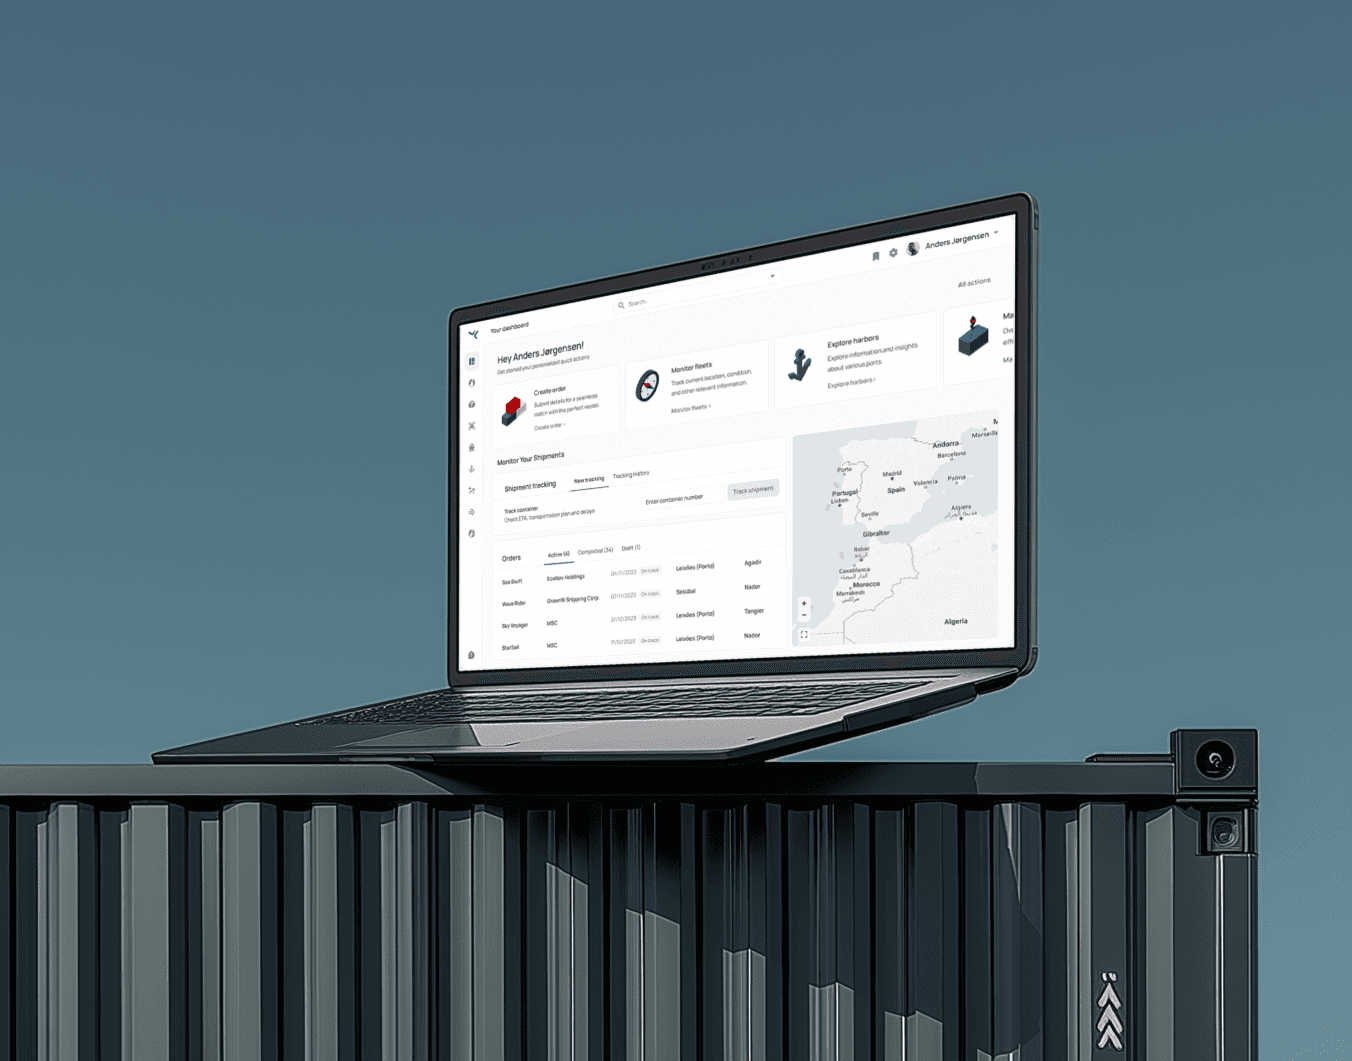
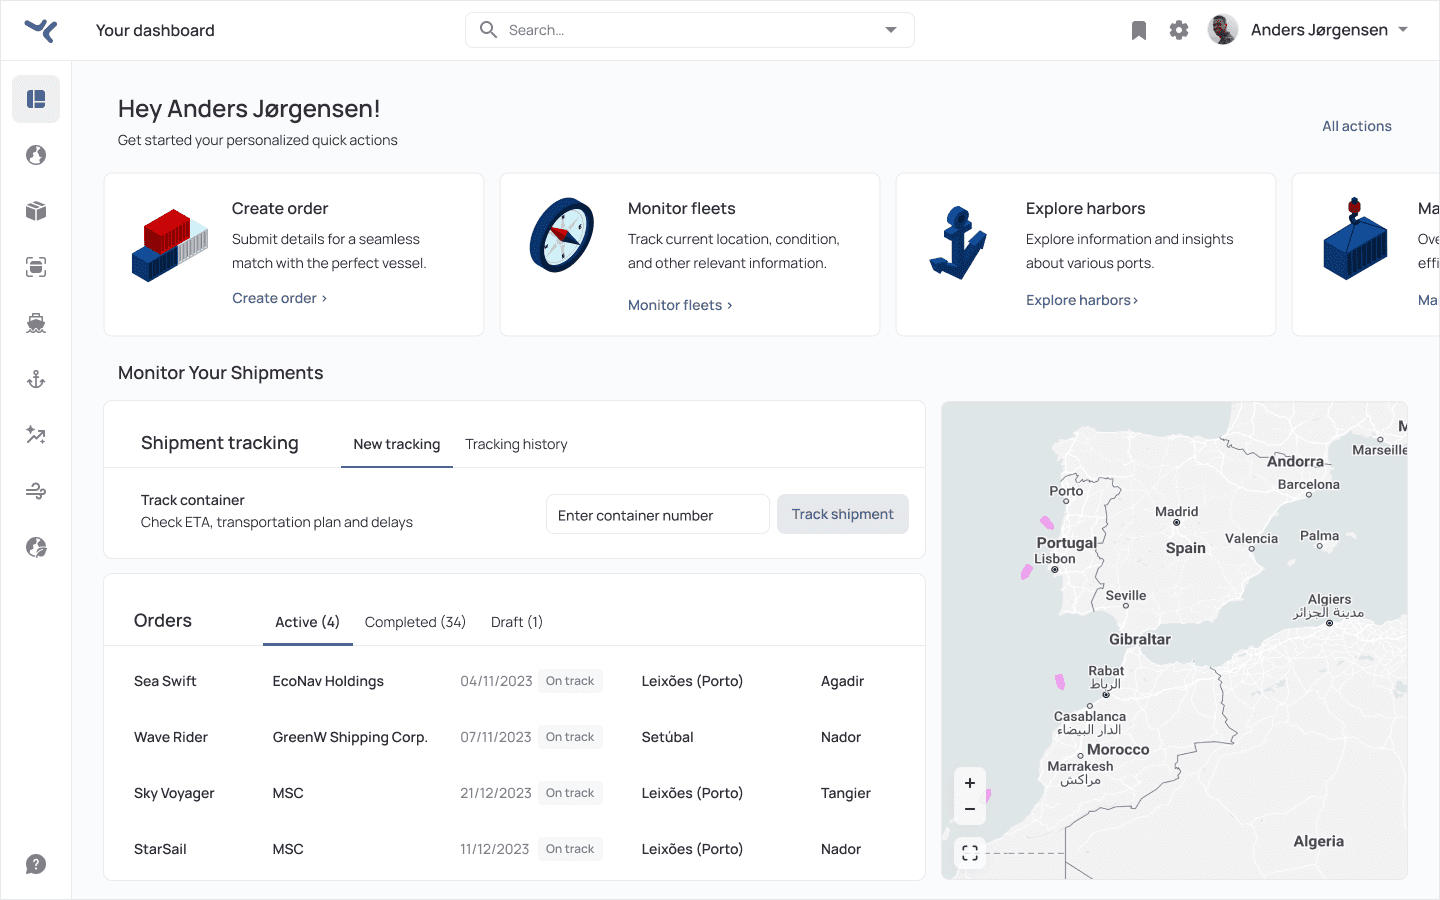
The platform is alive. Modules are connected. The flows from our early work appear again, now as part of a unified system that helps move the equivalent of more than 80 million fully loaded trucks.
TITLE CARD: Back to the present
(The storm forecast dashboard returns. The designer is again in the moment.)

Scene 5 —
New waters
DESIGNER: The new project group is different. All the domain knowledge and personas I learned earlier help, but the processes, modules and stages here follow a new logic. The modules are built by data-analytics geniuses who understand how tiny details in one process affect outcomes in another. They move through reports and systems instinctively, keeping dozens of connections in their minds at once.
This is where the main difficulty appears: the people using these reports are not analytics geniuses, and they work in real time under pressure. They must make fast decisions based on relevant insights, and every minute can mean millions gained or lost.
Simplify access to critical insights, remove unnecessary details, define the real user needs and deliver analytics that is reliable and relevant.
Scene 6 —
The Engine Room
The room where the real work happens: the details, the checks, the quiet decisions that keep everything running.
DESIGNER:
There are three designers and one researcher working on this direction. Sometimes we collaborate on the same discovery task, and sometimes each of us is responsible for completely different features within our own trio. It depends on the OKRs and the priorities of our stream. The product surface is diverse — from improving visuals in existing Power BI reports to discovering an entirely new vision. I’ll describe a few of the tasks I work on.
When I join the team, I start with a detailed usability evaluation. I identify several issues with navigation and filtering, and later improve some of them.
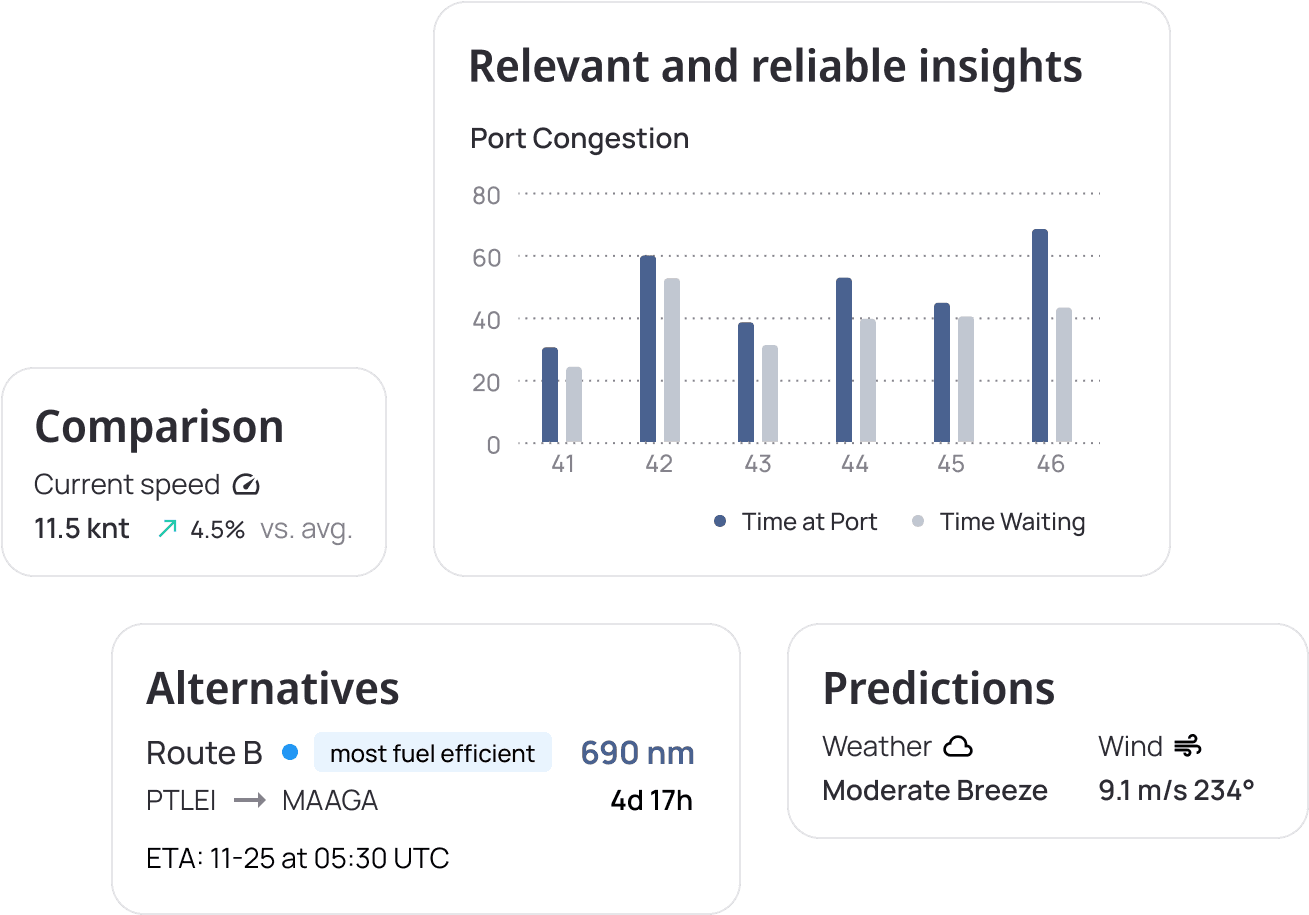
I work on improving analytics inside the reports and integrating them into a connected product so that the data appears at the right moment, in the right context (the merged version). I have access to SMEs, and I ask them all the small but important questions about the process. I describe the charts in detail, separating «what our data is saying» from «what our audience needs to hear.» In Miro, I build tables, run a usability audit for each chart, propose improvements, and group them based on user tasks. The team works with limited capacity, so we carefully decide which tasks are feasible now and which ones go to the backlog for the merged version.
DESIGNER (a small realization, it shows on my face): often, small changes improve the reports dramatically: a better title, a different chart type, a clearer visual, a short guide added to the page.
Alongside the smaller tasks, there are strategic ones for the merged version.
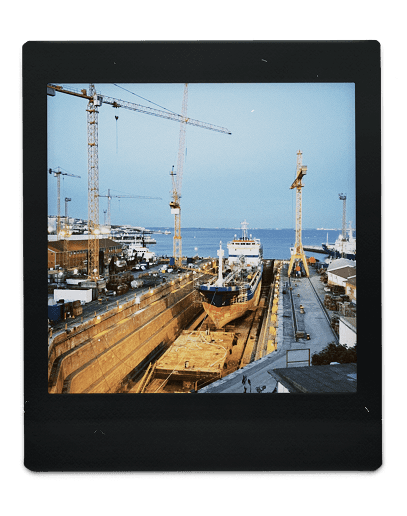
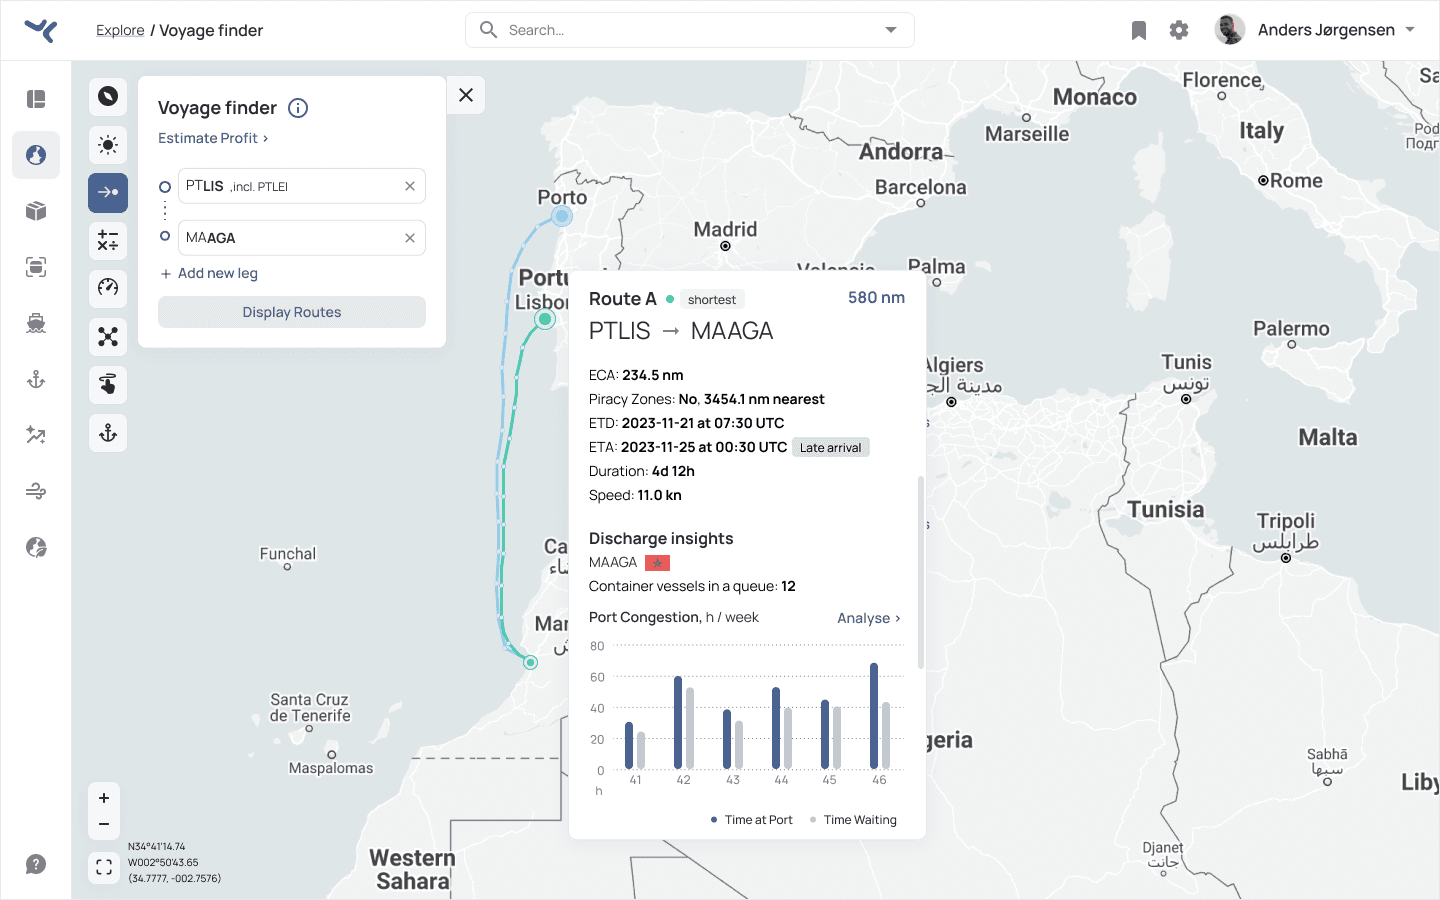
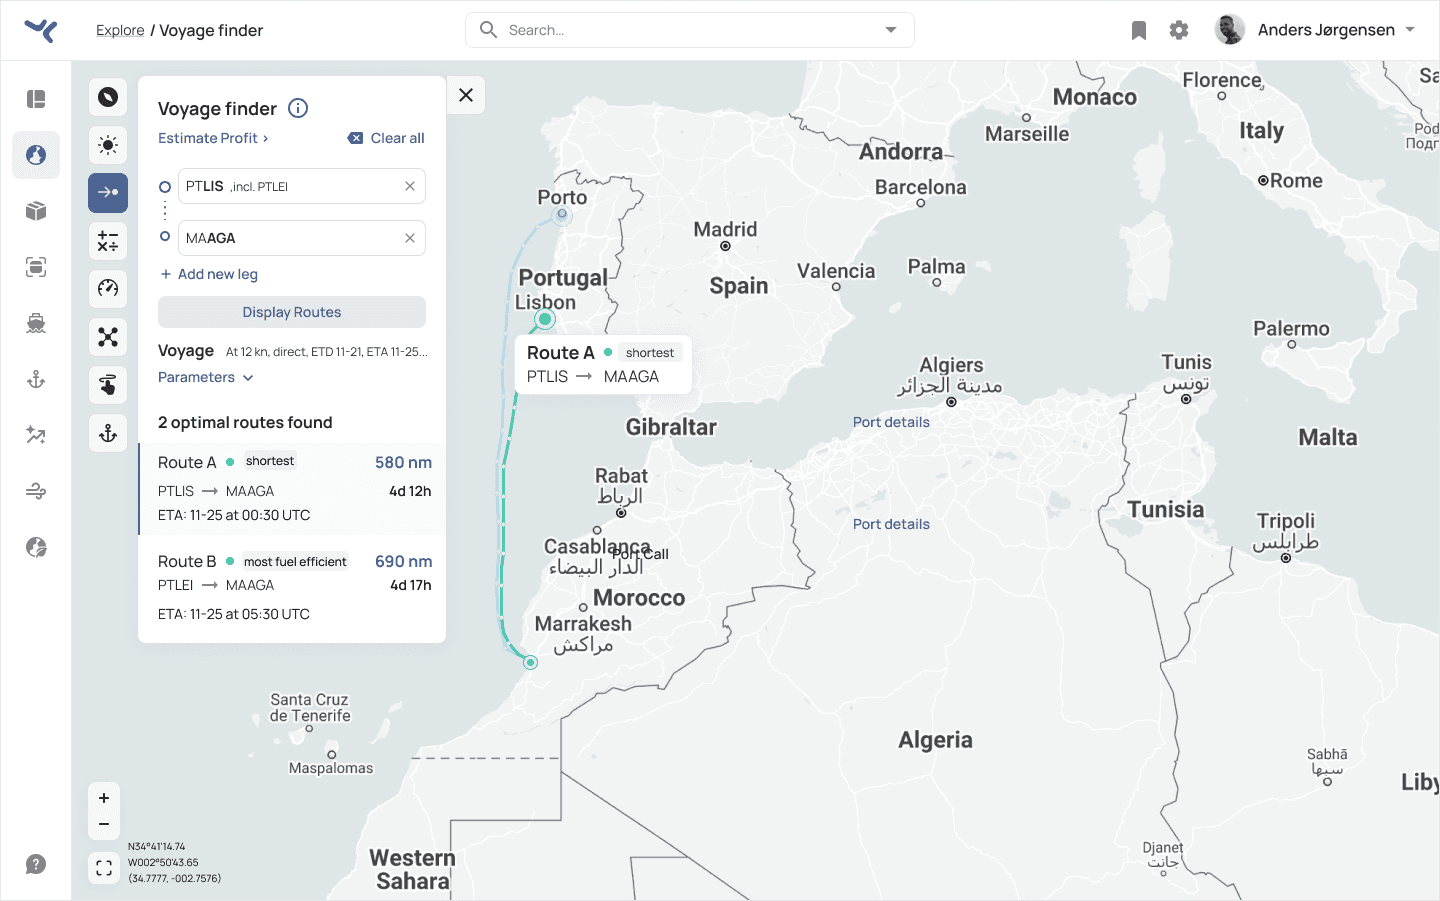
CUT TO: Lisbon port, a place where congestion is not a chart, but a daily reality.
For example, we need to improve the port congestion report. I spend several days analyzing real congestion metrics for selected ports, combining SME input, user insights, competitor audits and port-observation research.
I contribute to shaping the product vision for the entire direction. Together with the team, we create a detailed prototype and later validate it in a usability test in Maze.
SCENE 7 —
Docked
The ship slows down. The noise fades. We reach the dock, a quiet point where the journey becomes visible.
DESIGNER: By the time we dock, the captain shares results we cannot reveal — the kind that stay on the ship. But here is something I can share, the part of the impact I directly contributed to:
1
2
Reduced decision-making time for critical operations by surfacing insights earlier.
3
Introduced reusable patterns that sped up design and development cycles across multiple modules.
4
5
Reduced cross-team misalignment through shared personas and end-to-end mapping.
6
Enhanced customer satisfaction through continuous engagement and improvements.
END CREDITS
I’ve worked in global teams before, but this was my first time being part of a large multicultural design team with more than 15 designers and researchers working on the same interface. We supported different modules while staying connected as the thread between teams. This taught me new tools, perspectives and ways of working I use today.
This project was also my first time leading a full discovery phase. It felt daunting, almost like being the captain of a ship with no map. Oh wait… we were actually making the map.
It marked my exit from the COVID online world. Business trips came back. Workshops came back. Real faces came back. I used to be afraid of facilitating workshops, but after watching great examples and stepping in myself, the fear slowly faded. Now workshops energise me.
It was a project of growth, in process, in confidence, in communication and in myself.
TOOLS & TECHNICS
Tools
Figma
FigJam
Miro
Maze
Mixpanel
Power BI
TECHNICS
P. S.
If I ever wrote a screenplay for this project, it would probably look something like this. If you reached this point and understood at least a part of it, I’m truly glad.
(Fade out.)
(End of case.)